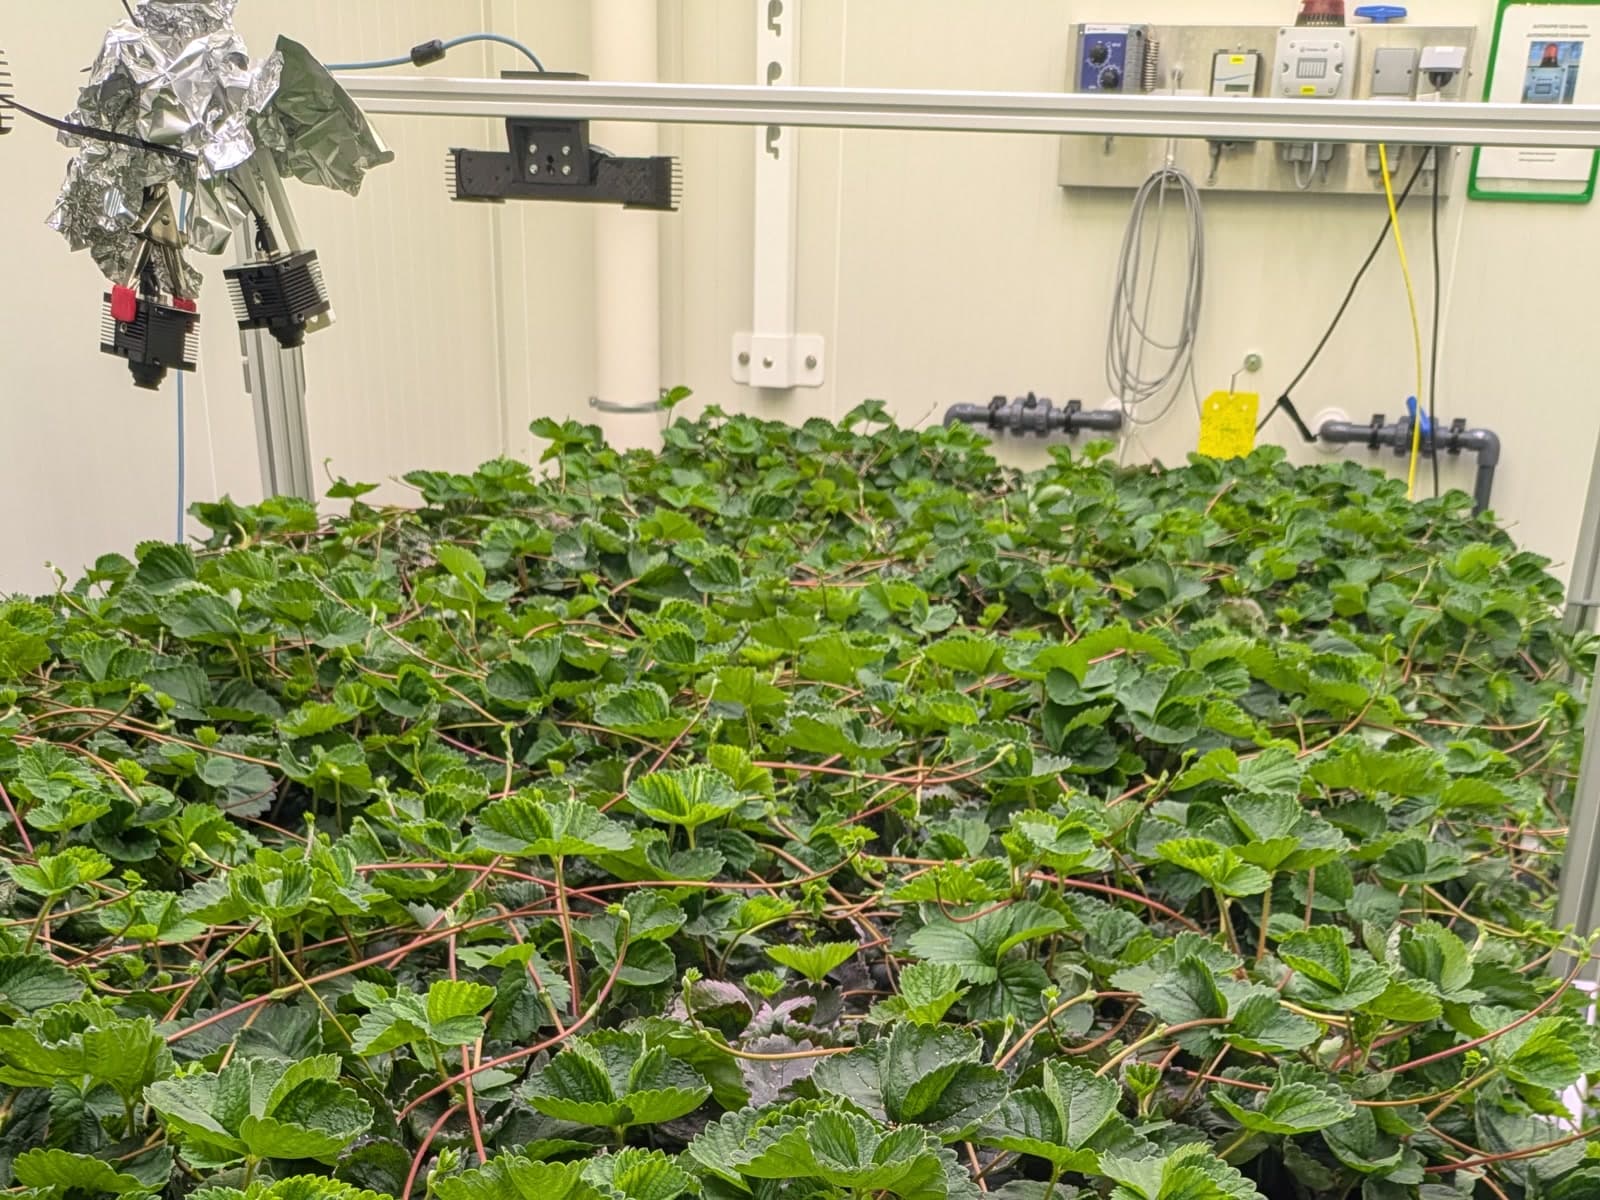
How do you measure growth without touching the plant?
The greenhouse experiment started with a simple question: could a steady flow of air affect how strawberry plants grow? Answering it meant comparing how the plants changed over time, without repeatedly measuring or disturbing them by hand.
Two overhead 3D cameras captured colour, depth and point-cloud data throughout the experiment. The challenge was turning those scans into something measurable: identifying the same plant over time, isolating it in 3D and extracting changes in its shape.
From camera scan to plant measurements
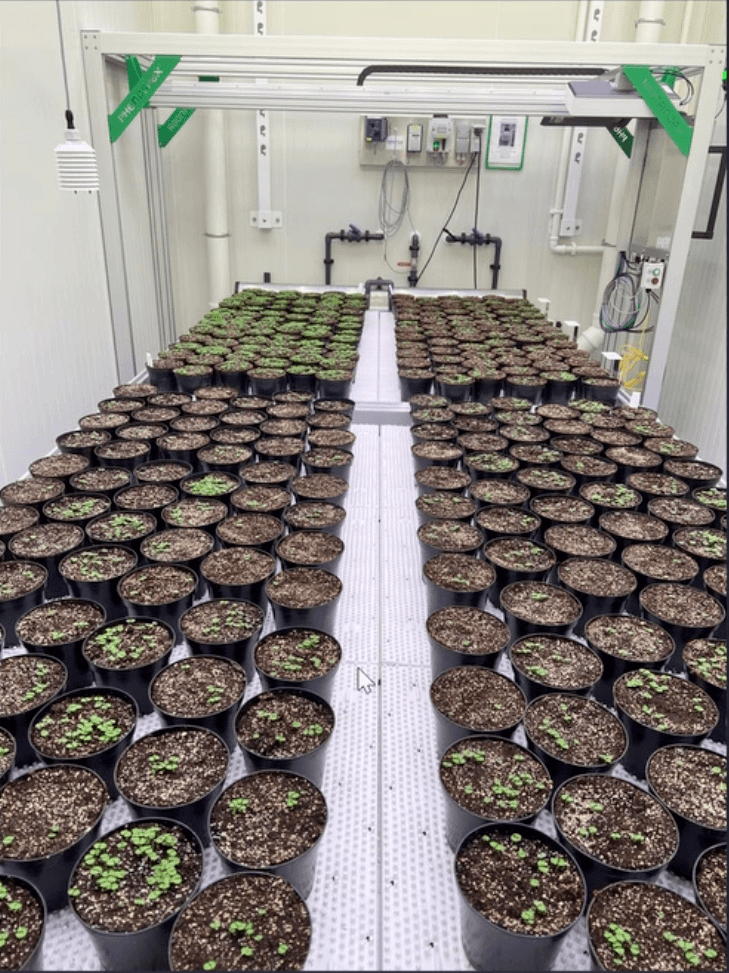
- Capture the scene. Two overhead Photoneo cameras captured colour, depth and organized 3D point clouds for the airflow and control tables.
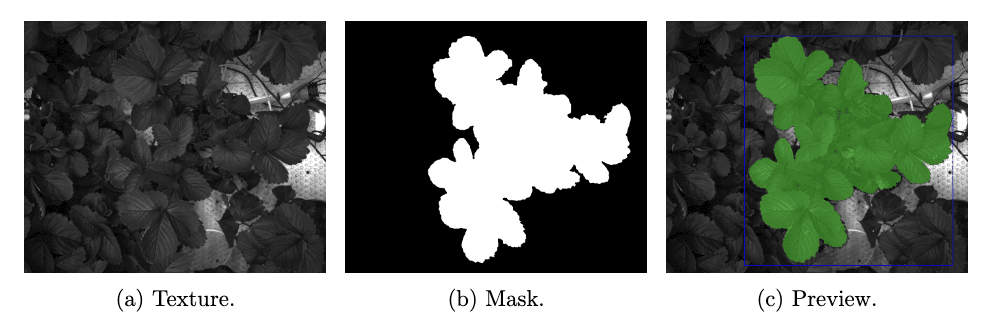
- Find and follow one plant. The first scan was labelled interactively with SAM 2 (Opens in a new tab), using a few positive and negative points to isolate the target plant. From there, SAM 2 (Opens in a new tab) propagated the mask through later scans. Tracking was reviewed whenever mask overlap fell below 0.90 or after 20 frames, correcting the mask when growth or overlap caused it to drift.
- Move from 2D to 3D. Each pixel in the camera image corresponded directly to a point in the organized 3D scan. That meant the 2D SAM 2 (Opens in a new tab) mask could be projected straight onto the point cloud, leaving only the geometry of the tracked plant.
- Measure how it changes. Once isolated in 3D, geometry-based methods estimated plant height, visible leaf area and leaf angle across the scan sequence.
Tracking leaves through time
Once the target plant was isolated, the same idea could be taken down to individual leaves. Visible leaves were segmented separately and assigned their own IDs, allowing the same leaf to be followed from one scan to the next.
As the canopy became denser, leaves overlapped, disappeared and changed shape. That made leaf-level tracking considerably harder than following the plant as a whole, and occasional manual corrections were needed to keep identities consistent.
Turning the point cloud into measurements
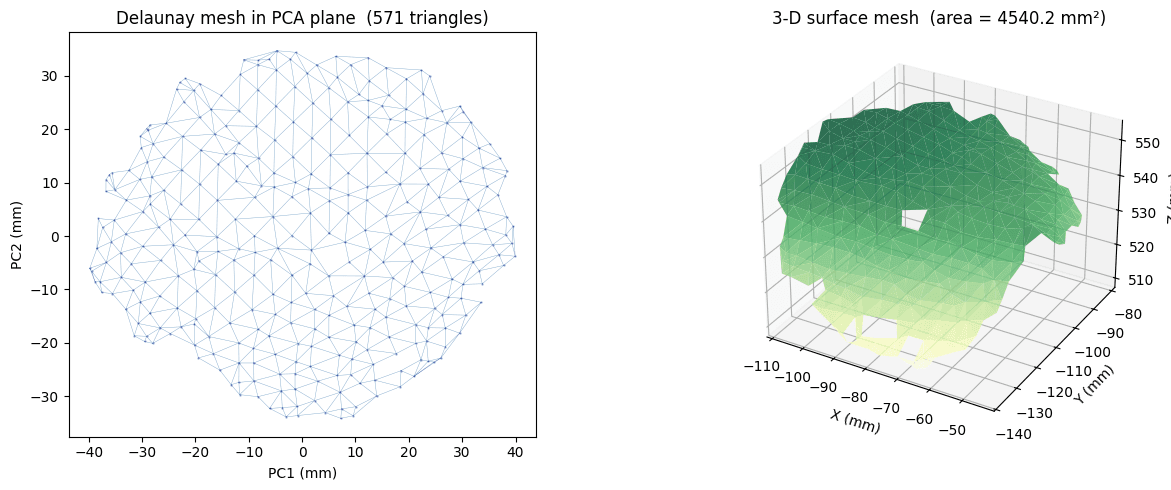
With the plant isolated in 3D, the point cloud could be reduced to measurements that could be compared over time.
Plant height was measured relative to a reference plane fitted to each greenhouse table. Instead of using the single highest point, which could easily be sensor noise, the pipeline used the 99th percentile of the plant’s distance from the table.
At leaf level, fitted planes provided an estimate of leaf angle, while cleaned point clouds were triangulated to estimate visible leaf area. These were treated as relative measurements rather than exact physical dimensions: the goal was to capture how the plant changed between scans.
What the proof of concept showed
- A working 2D-to-3D pipeline could turn repeated camera scans into trackable plant geometry and growth measurements.
- SAM 2 (Opens in a new tab) could maintain plant identity across consecutive scans, with periodic human review to catch tracking drift.
- Height, visible leaf area and leaf angle could be followed over time, although the values were more useful for relative change than exact physical measurement.
- The quality of the measurements started at capture time: camera position, occlusion and neighbouring plants determined how much useful geometry was available later.
Where the setup fell short
The monitoring system was added after the airflow experiment was already underway, so the greenhouse and camera layout had not been designed around computer-vision measurements from the start.
A single top-down view worked well for the upper canopy, but lower leaves and side-facing structures were often hidden. As neighbouring plants grew, their leaves also overlapped the target plant. The main lesson was that capture and analysis have to be designed together: a future setup would use more viewing angles, more separation between plants and automatic checks on every scan.